
Part of the Misty Blue boat project.
The idea
One of the things I want to get out of the electronics on Misty Blue is a proper record of where the boat has been and what was happening while she was there. At the moment, the navigation instruments know an enormous amount about the boat: position, speed, heading, wind, depth and, depending on what is available on the NMEA network, electrical and engine information as well. The problem is that most of that information normally disappears as soon as the trip is over. I want to change that. The idea is an automatic boat log that records the data continuously, turns it into useful information, and builds a readable account of each voyage without requiring me to sit down afterwards and reconstruct it.
The hardware is deliberately simple
The missing piece at the moment is an Actisense W2K-2. Once that is installed on the NMEA 2000 network, it should give me a way of getting the boat’s instrument data onto the boat’s network. The boat already has a Teltonika RUT955, so the intention is not to add another cellular subscription or another proprietary marine tracking service. The gateway and router should be all the additional boat-side equipment required. When the boat is at the marina, the RUT955 can use the reliable shore Wi-Fi. When it is away from the marina, it can use its 4G connection. The important part is that the data remains mine. There is no subscription-based marine cloud service sitting in the middle of the system.
The home server does the clever stuff
The other half of the system will run on my existing home server. The W2K-2 provides the raw boat data. The server will collect it, store it as time-series data and turn it into the various views shown here. I already have a local weather service on the server using Met Office data for the house. I can extend that so that the same service can obtain weather information for the boat’s actual position and time. That means a voyage can eventually contain not just what the instruments recorded, but the corresponding weather conditions as well. The original data should also be retained. That matters because it means I can improve the software later and reprocess old voyages rather than throwing away information that seemed unimportant at the time.
The home page
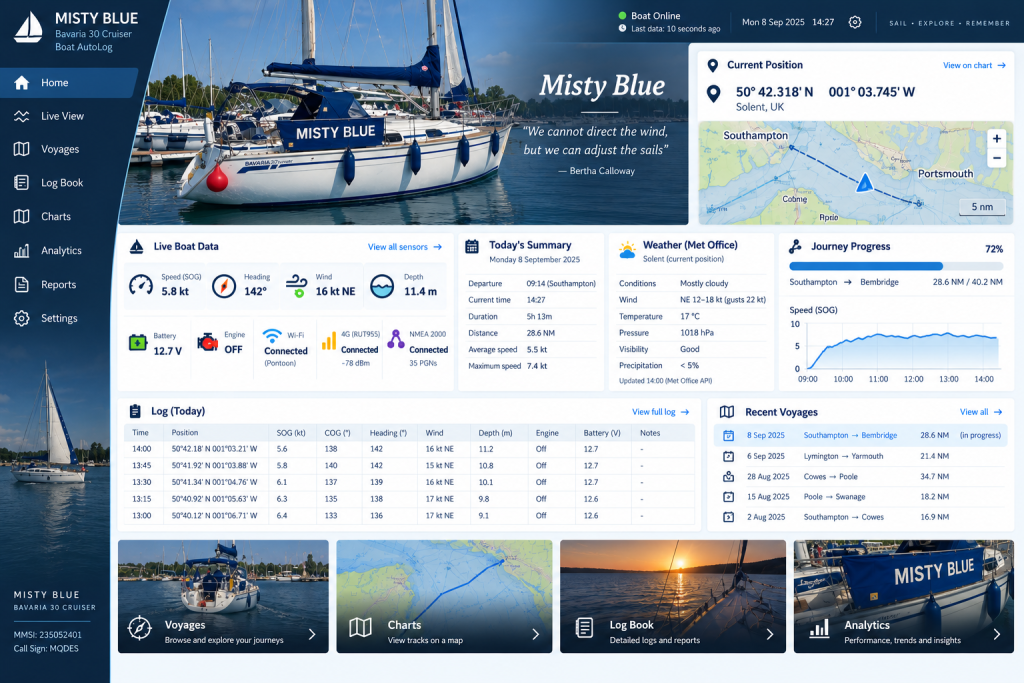
The proposed home page is intended to answer the simple question: what is Misty Blue doing? It shows the current position, speed, heading, wind, depth, electrical state, engine state and connectivity, alongside a map and the current voyage summary. It is deliberately more like a boat instrument panel than a generic database dashboard. The aim is to make the important information immediately understandable while keeping the detailed data available underneath it.
Live data
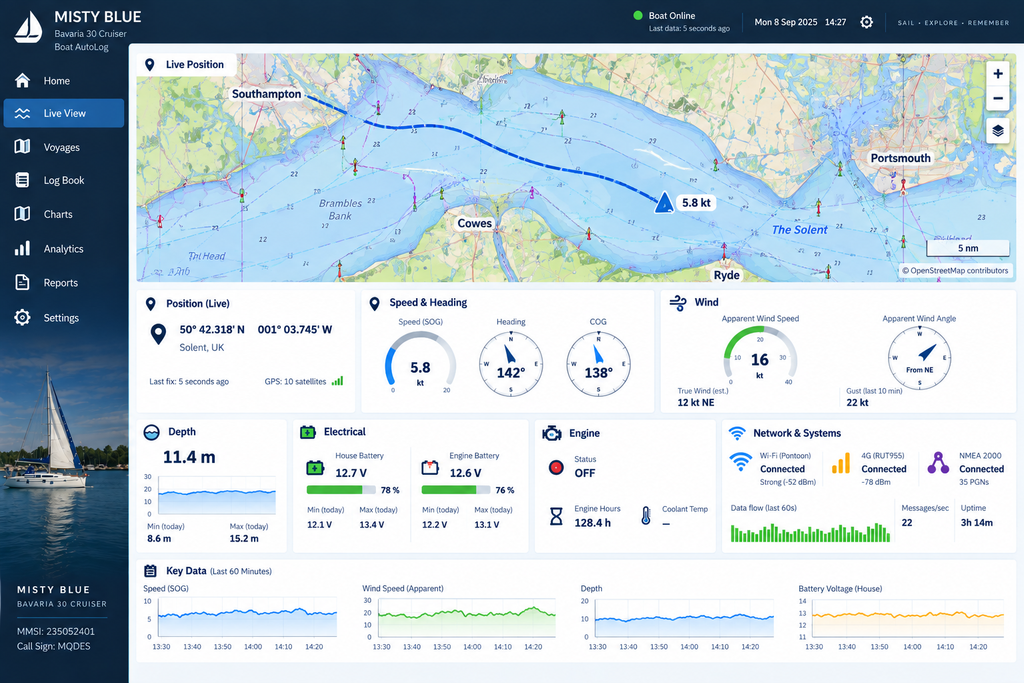
The live view concentrates on the actual telemetry coming from the boat. The map gets the largest piece of the screen because position is the common thread through almost everything else. Around it are the navigation, wind, depth, electrical, engine and network measurements. The separate Wi-Fi, 4G and NMEA indicators are intentional. I want to be able to tell at a glance whether the boat is connected to the marina Wi-Fi, using the RUT955’s 4G connection, and whether the NMEA data itself is arriving normally. The charts at the bottom provide a short history rather than just showing a single instantaneous number.
The automatic log book
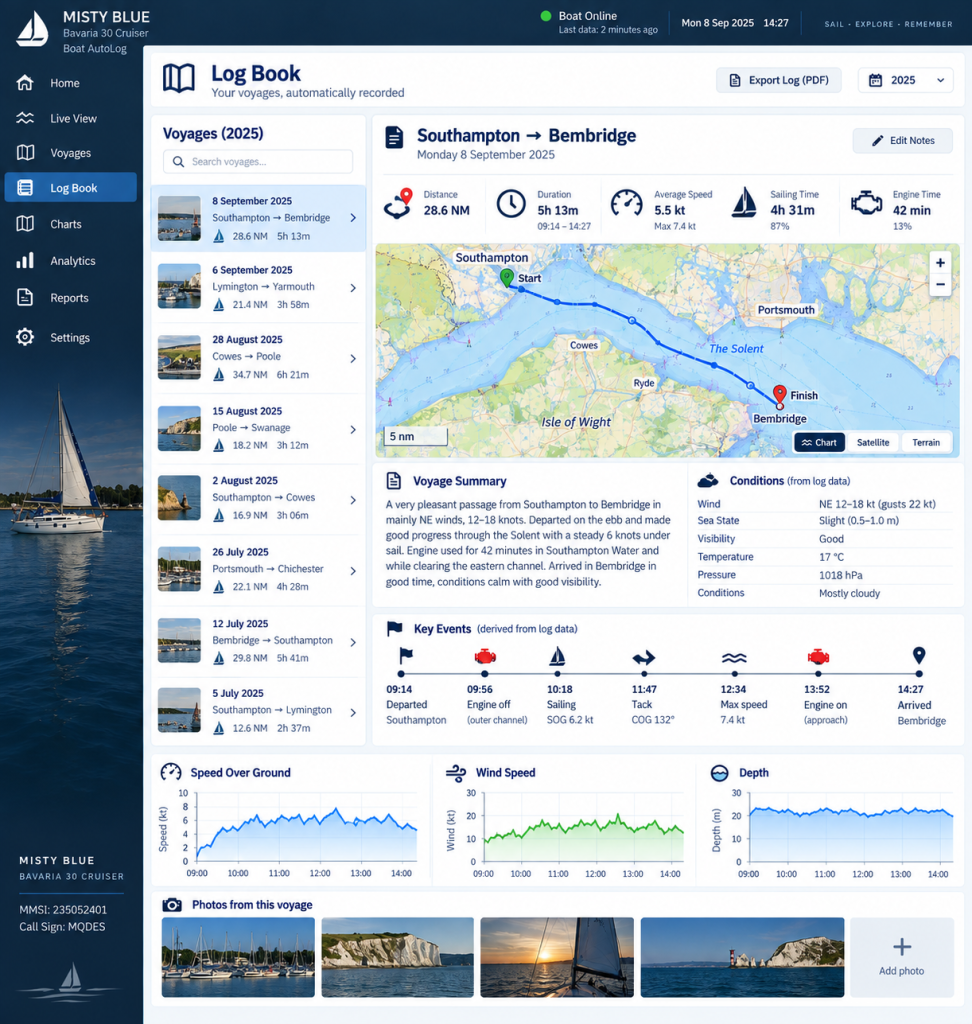
The log book is where the raw data starts becoming a record of a trip. Rather than producing pages of numbers, each voyage gets a structured summary: distance, duration, average and maximum speed, sailing and engine time, weather and sea conditions, followed by the route and significant events. The interesting part is the narrative. The system can derive events from the data — departure, engine on or off, sailing, changes of course, maximum speed, arrival and so on — and use those events and the measured conditions to produce a short written account of the voyage. So instead of me writing:
Left Southampton. Sailed to Bembridge. Wind was 12–18 knots.
the system can construct a much richer summary from the actual recorded data. There will still be a facility for me to add my own notes, because an automatic log cannot know everything that happened aboard.
Charts
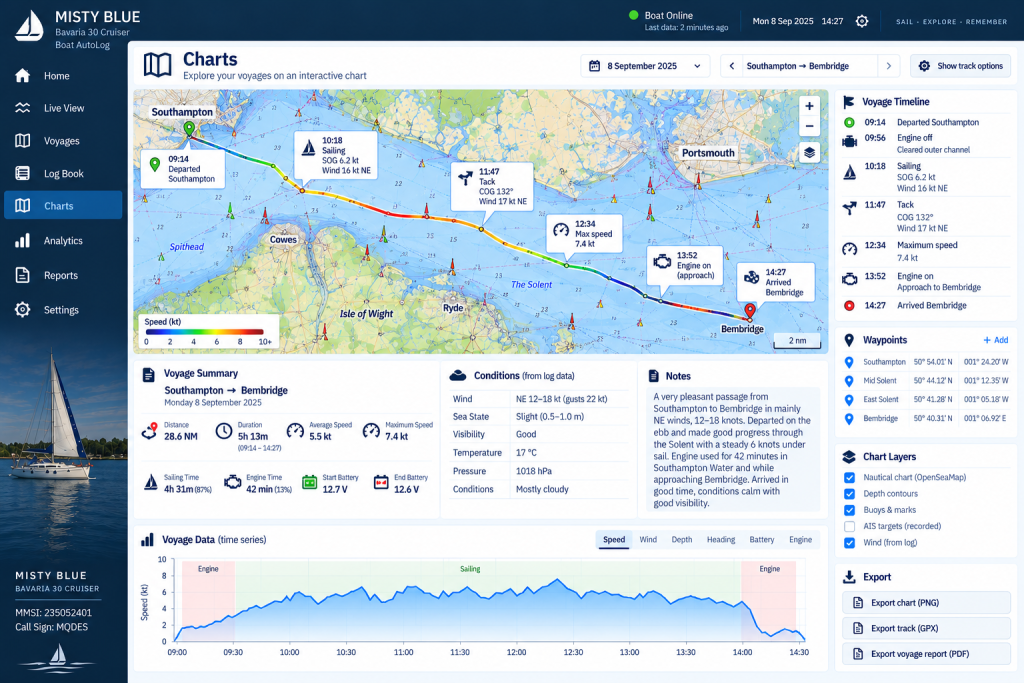
The charts page is intended to be the visual heart of the system. Every recorded GPS position can be plotted to create the actual track of the voyage. The track can then have call-outs attached to points where something interesting happened: departure, engine changes, tacks, maximum speed, arrival and other automatically detected events. Because the underlying data is time-stamped, selecting a point on the track can also show the conditions at that moment — speed, heading, wind, depth, battery state and whatever other information was available. This isn’t intended to replace the Raymarine navigation system or its charts. It is a historical record of where the boat actually went.
Analytics
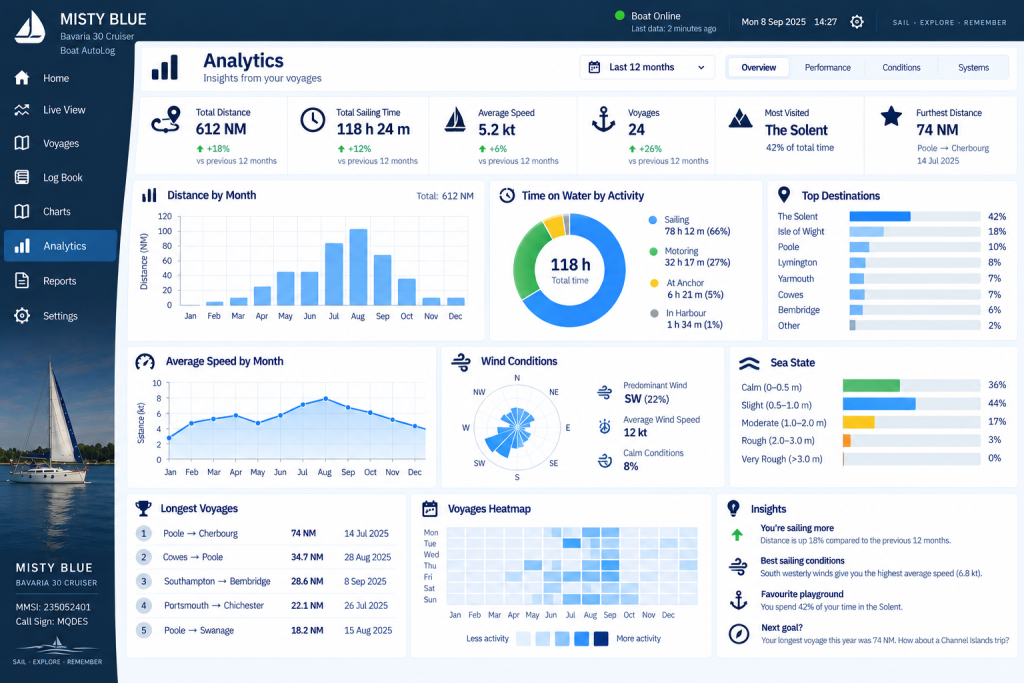
Once enough voyages have accumulated, the data becomes useful for something beyond remembering individual trips. The analytics page can look across the history of the boat: total distance, sailing time, average speeds, destinations, wind conditions, sea state and the longest passages. It should also be possible to answer questions that would otherwise require a lot of manual record keeping. How much sailing did I actually do this year? Which months were busiest? What wind conditions produced the best speeds? Where do I spend most of my time? Which were the longest passages? Those are the sorts of questions that become almost trivial once the data has been recorded consistently.
Reports
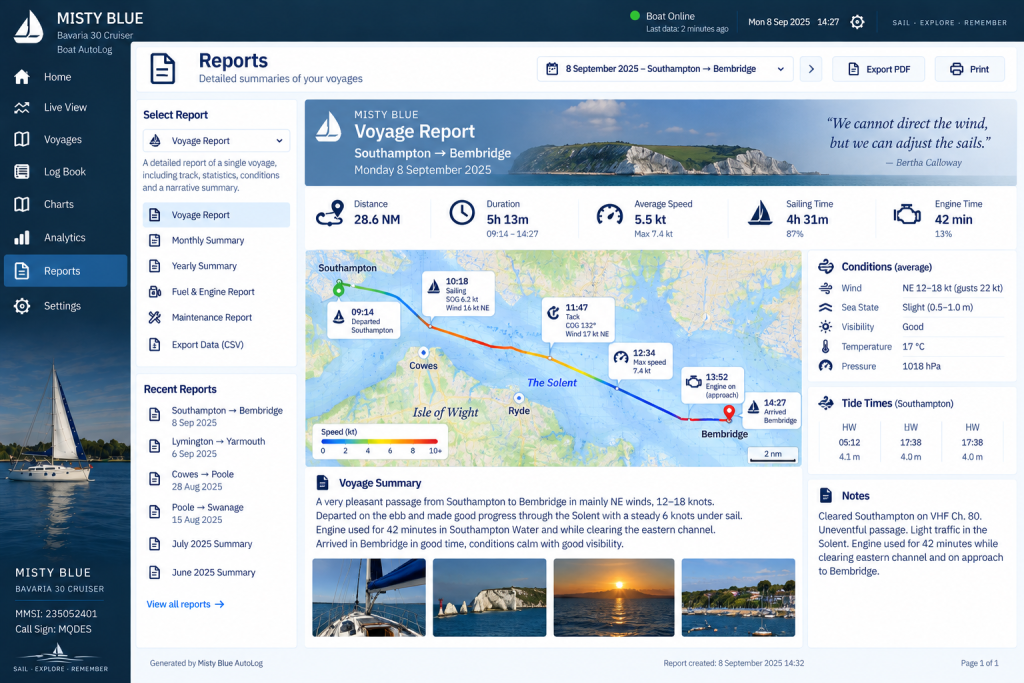
Finally, the reports page turns a voyage into something that can be kept as a proper record. A report can combine the route, statistics, weather, tide information, significant events, notes and photographs into a single document. The intention is that it can be exported as a PDF, printed, or simply kept as part of the boat’s digital history. Over time this could become a surprisingly good archive of the boat’s life: not just a collection of GPS tracks, but a record of where Misty Blue went, how she performed, what the weather was doing and what happened along the way.
Where the project is now
This is still a design rather than a working system. I don’t want to start writing the data collector until the W2K-2 is installed. At that point I can see exactly what the existing NMEA 2000 network is actually providing, identify the available data, and build the software around the real messages rather than assumptions. The eventual architecture should be fairly straightforward:
NMEA 2000
    ↓
Actisense W2K-2
    ↓
RUT955 / boat network
    ↓
Internet
    ↓
Home server
    ↓
Time-series database
    ├── Live dashboard
    ├── Automatic log book
    ├── Voyage charts
    ├── Analytics
    └── Reports
The objective is simple: install the gateway, collect the data, and let the computer keep the log.